


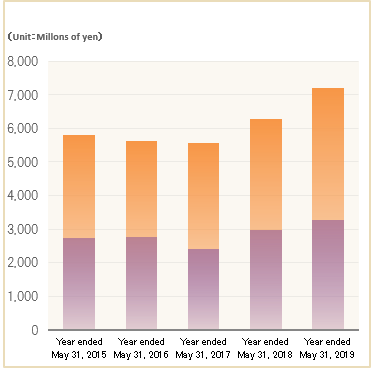
Net Sales (Consolidated)
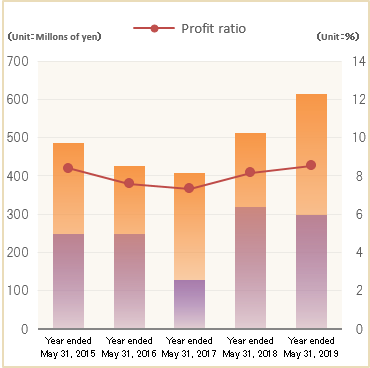
Operating Income (Consolidated)
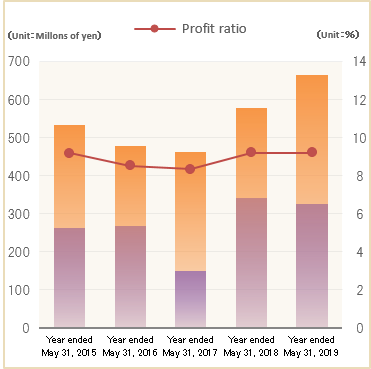
Ordinary Income (Consolidated)
Current Net Income (Consolidated)
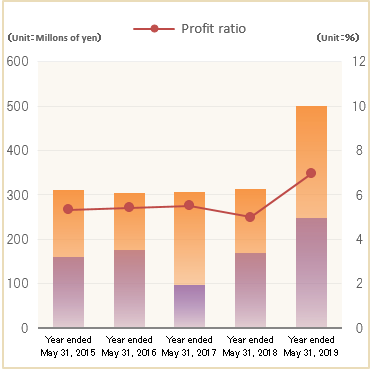
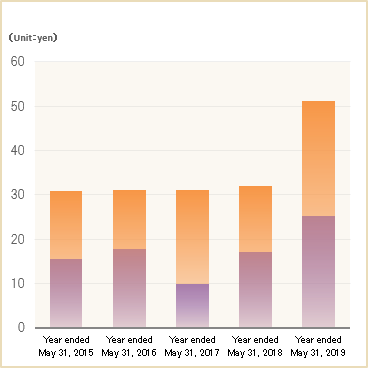
Earnings per Share (Consolidated)
Consolidated Balance Sheet
Assets
(Unit: Millions of Yen)
| Item | Year ended May 31, 2018 | Year ended May 31, 2019 |
|---|---|---|
| Current assets | 5,374 | 5,784 |
| Fixed assets | 4,691 | 4,844 |
| Tangible fixed assets | 215 | 231 |
| Intangible fixed assets | 12 | 21 |
| Investments and other assets | 4,463 | 4,591 |
| Total assets | 10,066 | 10,628 |
Liabilities
(Unit: Millions of Yen)
| Item | Year ended May 31, 2018 | Year ended May 31, 2019 |
|---|---|---|
| Current liabilities | 1,466 | 1,650 |
| Fixed liabilities | 85 | 155 |
| Total liabilities | 1,551 | 1,806 |
Net assets
(Unit: Millions of Yen)
| Item | Year ended May 31, 2018 | Year ended May 31, 2019 |
|---|---|---|
| Shareholder's equity | 8,077 | 8,391 |
| Capital stock | 1,487 | 1,487 |
| Capital surplus | 2,174 | 2,244 |
| Earned surplus | 4,810 | 5,095 |
| Treasury stock | -394 | -436 |
| Accumulated other comprehensive income | 437 | 430 |
| Difference in valuation of other securities | 437 | 430 |
| Total net assets | 8,514 | 8,822 |
| Total liabilities and net assets | 10,066 | 10,628 |
Consolidated Statements of Income
(Unit: Millions of Yen)
| Item | Year ended May 31, 2018 | Year ended May 31, 2019 |
|---|---|---|
| Net sales | 6,289 | 7,215 |
| Cost of sales | 4,964 | 5,683 |
| Gross profit | 1,324 | 1,531 |
| Selling, general and administrative expenses | 811 | 916 |
| Operating income | 512 | 615 |
| Non-operating income | 77 | 58 |
| Non-operating expenses | 10 | 8 |
| Ordinary income | 579 | 665 |
| Extraordinary income | - | 30 |
| Extraordinary losses | 86 | 0 |
| Net income before income taxes | 493 | 695 |
| Corporate, inhabitant and enterprise taxes | 238 | 253 |
| Adjustment for corporate and other taxes | -59 | -61 |
| Net income attributable to owners of parent | 314 | 501 |
| Other comprehensive income | 160 | -6 |
| Comprehensive income | 474 | 496 |
Consolidated Statements of Cash Flows
(Unit: Millions of Yen)
| Item | Year ended May 31, 2018 | Year ended May 31, 2019 |
|---|---|---|
| Cash flows from operating activities | 501 | -217 |
| Cash flows from investing activities | -525 | 385 |
| Cash flows from financing activities | -301 | -359 |
| Net decrease in cash and cash equivalents | -325 | -191 |
| Cash and cash equivalents at beginning of year | 2,113 | 1,788 |
| Cash and cash equivalents at end of year | 1,788 | 1,596 |
Segment Information
(Unit: Millions of Yen)
| Business Segment | Sales | Income | |||
|---|---|---|---|---|---|
| Year ended May 31, 2018 |
Year ended May 31, 2019 |
Year ended May 31, 2018 |
Year ended May 31, 2019 |
||
| Control Systems | Half year | 514 | 542 | 136 | 133 |
| Year | 1,188 | 1,290 | 272 | 287 | |
| Automotive Systems | Half year | 750 | 850 | 165 | 185 |
| Year | 1,650 | 1,867 | 359 | 420 | |
| Particular Information Systems | Half year | 300 | 222 | 80 | 47 |
| Year | 561 | 594 | 124 | 107 | |
| Embedded Systems | Half year | 379 | 472 | 100 | 116 |
| Year | 798 | 951 | 195 | 217 | |
| Industrial & Public Information Systems | Half year | 646 | 756 | 159 | 179 |
| Year | 1,284 | 1,606 | 308 | 366 | |
| IT Management Services | Half year | 395 | 439 | 54 | 78 |
| Year | 807 | 905 | 100 | 162 | |
Note: The segment income does not include company-wide expenses not allocated to each segment.